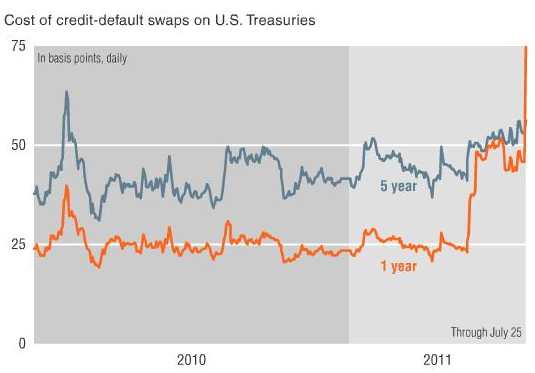
Yesterday FT.com’s Alphaville posted a graph showing that the US treasuries CDS graph had inverted for the first time ever.
What that means is that the cost to insure against default on 1 year US Treasury Notes costs more than it does to insure a 5 year note. This goes contrary to economic liquidity preference theory – meaning that investors generally see bonds with a longer maturity as being riskier so to insure them usually costs more.
So why does it cost more to insure a 1 year treasury bond? Investors see the risk for the US government as significantly higher in the short term and that psychology creates this weird effect.
Footnote: I’ll make this clearer in another blog entry but for now I’d like to add that I see the risk of an actual default by the US government is extremely close to zero. If we don’t get our act together by August second, we don’t automatically default. We just have to gradually make harder and more irresponsible decisions about who to pay and what to defer. Those decisions have a forcing effect on our political system as pressure will rapidly mount beyond calls from disgruntled constituents to calls from creditor’s lawyers.

Leave a Reply